A soundscape made with publicly available data from the Toronto Regional Conservation Authority
Using hundreds of thousands of data points measuring wind, water level, temperature and precipitation from January 1 to December 31, 2023 collected by the Toronto Regional Conservation Authority (TRCA), this project turns water and weather conditions of the Don River in Toronto into a soundscape.
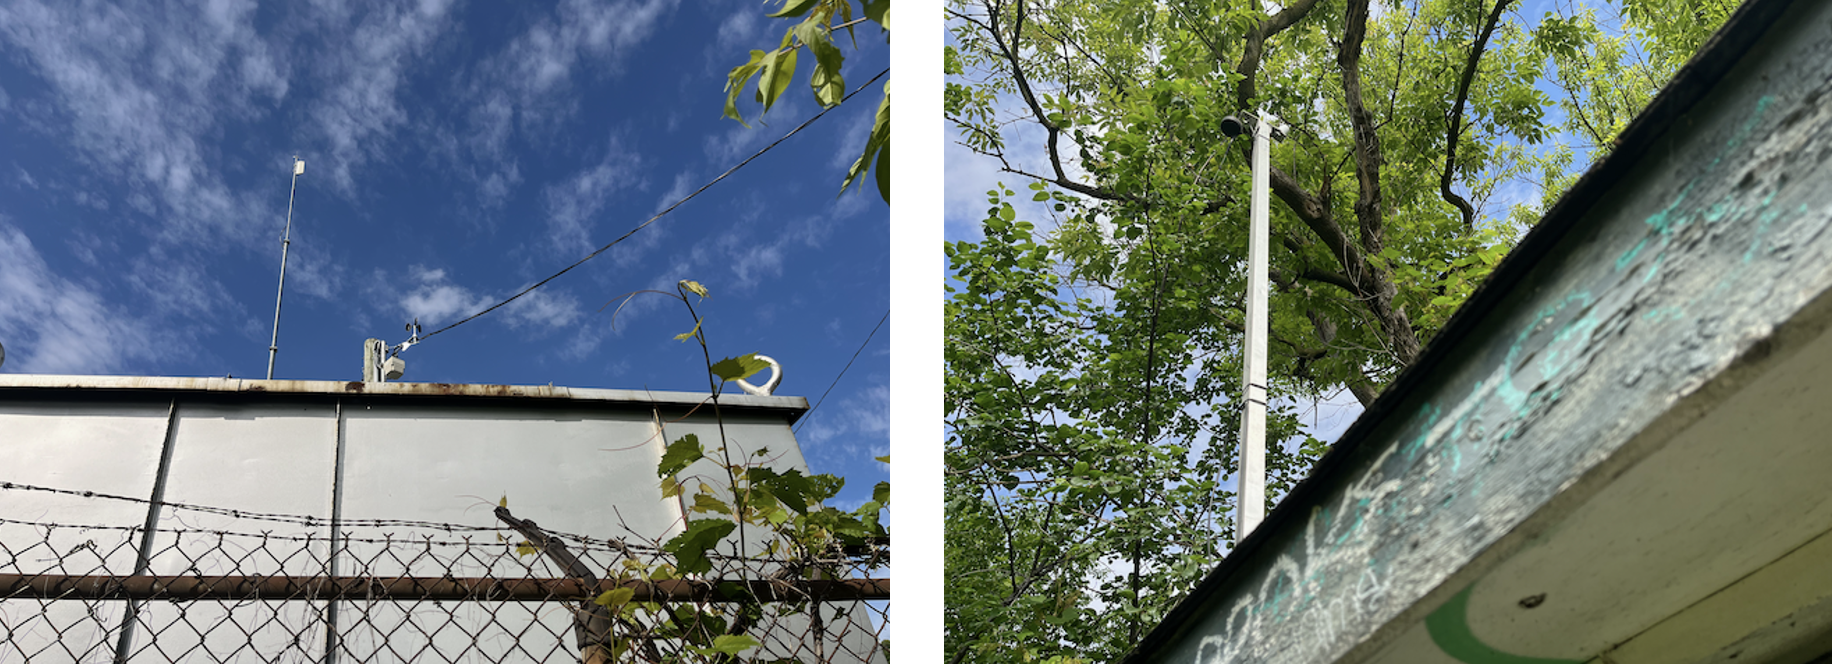
Much of this data comes from TRCA’s Station 19 and several other gauging stations along the rivers in the Toronto area which measure water level, flow, temperature and precipitation at regular intervals. This project combines a year’s worth of this data about the Don River with solar activity data such as solar flares and Coronal Mass Ejections into a 24-minute soundscape. Each data stream has its own voice which interacts with the others. Some of these sounds, such as the sounds trigged by solar activity, are synthesized while others, such as wind, rain, snow and underwater currents, were recorded along the Don River.
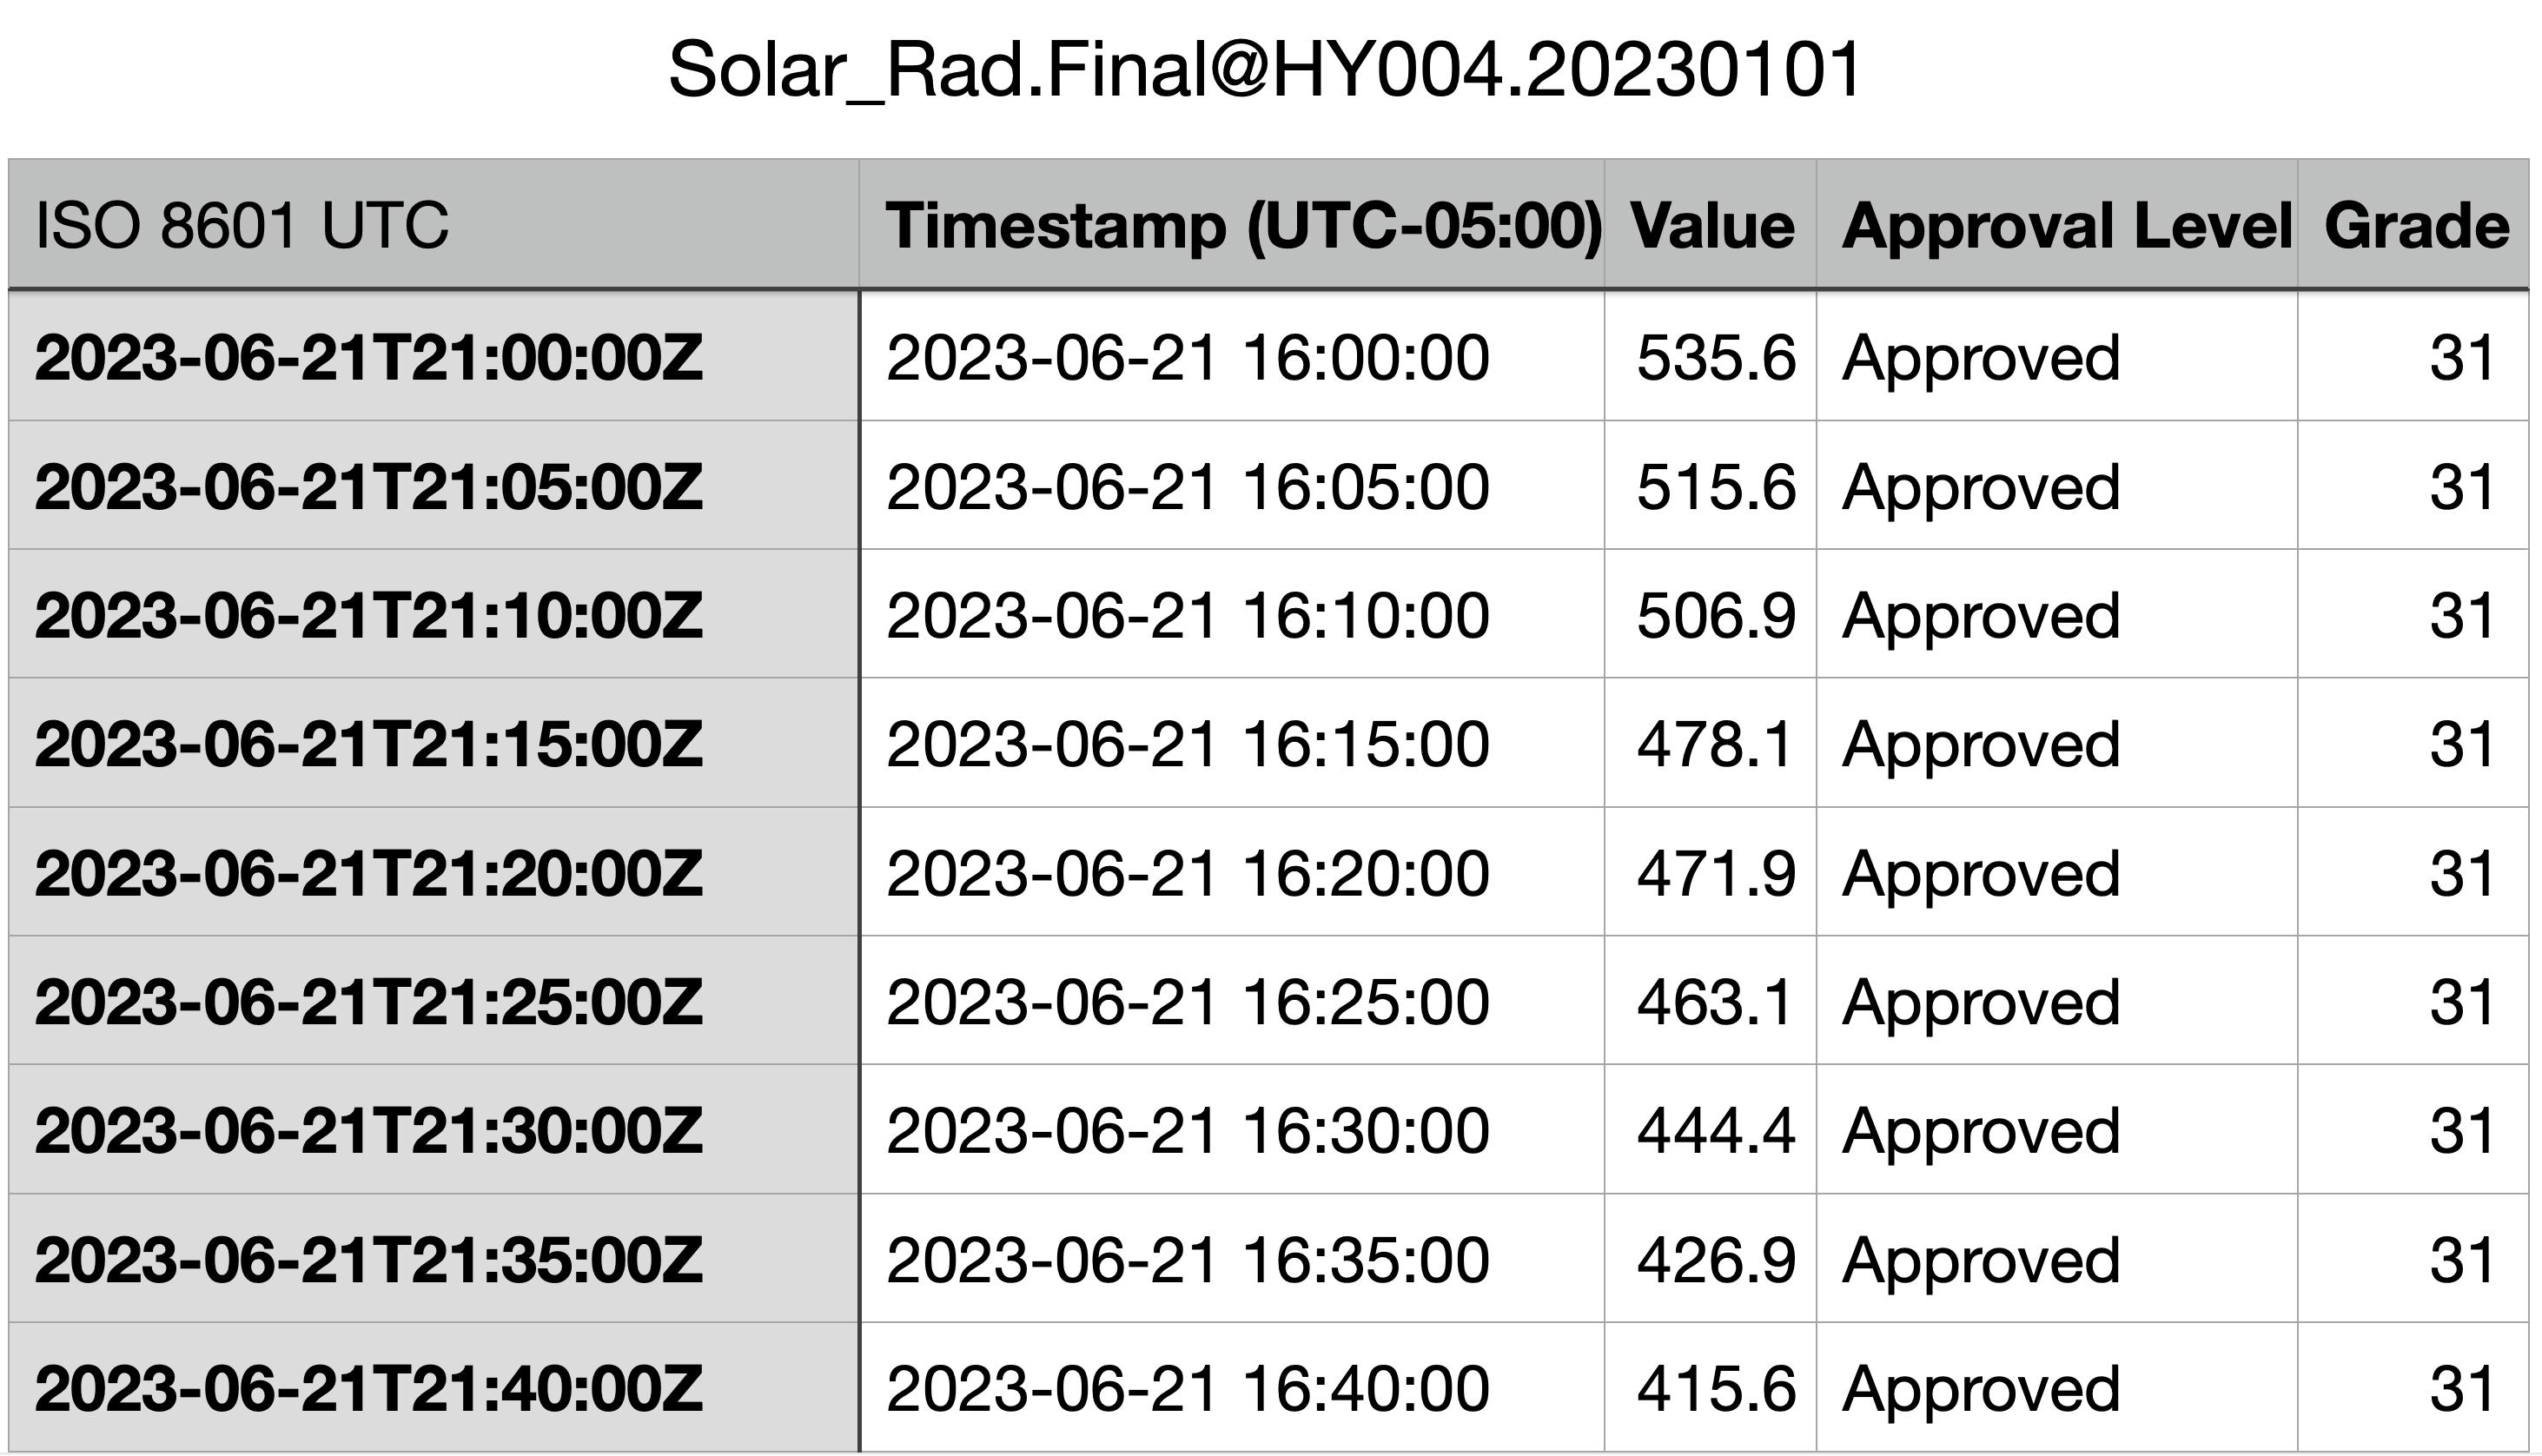
The first step in creating this soundscape was to access the data. I was able to obtain measurements of water level, water temperature, water flow, precipitation and solar radiation data from the TRCA’s Open Data Portal. What makes the TRCA data so useful for this project is that is the sensor readings are captured very frequently. For certain types of data, such as solar radiation, the sensor readings are captured every 5 minutes, in others cases, such as water temperature, they are captured every 15 minutes. This is very high resolution data – much higher than one would normally find in public databases of historical weather. To give you an idea of the resolution, there were 34,969 measurements of water temperature and 123,792 of solar radiation covering the period January 1 – December 31, 2023. Below is a sample of the solar radiation data from the TRCA Open Data Portal (value = watts per square metre) from 12:00 – 12:40 pm on June 21st, 2023.
Since the TRCA’s data collection included solar radiation data, I was interested in exploring how other kinds of solar activity might be integrated into the composition as a way of connecting micro-level variations in water, wind, etc. at a specific site on the Don River to macro-level fluctuations of energy – not only on a planetary level but also on the heliospheric level (i.e., systems influenced by the sun). To do this, I integrated data from NASA’s First Fermi-LAT Solar Flare Catalog (FLSF) and the SEEDS catalogue of Coronal Mass Ejections and filtered the list to focus on events that had a high enough magnitude to affect GPS and other navigations systems as well as radio communications. These datasets were filtered so that they align with the 2023 data I obtained from the TRCA.
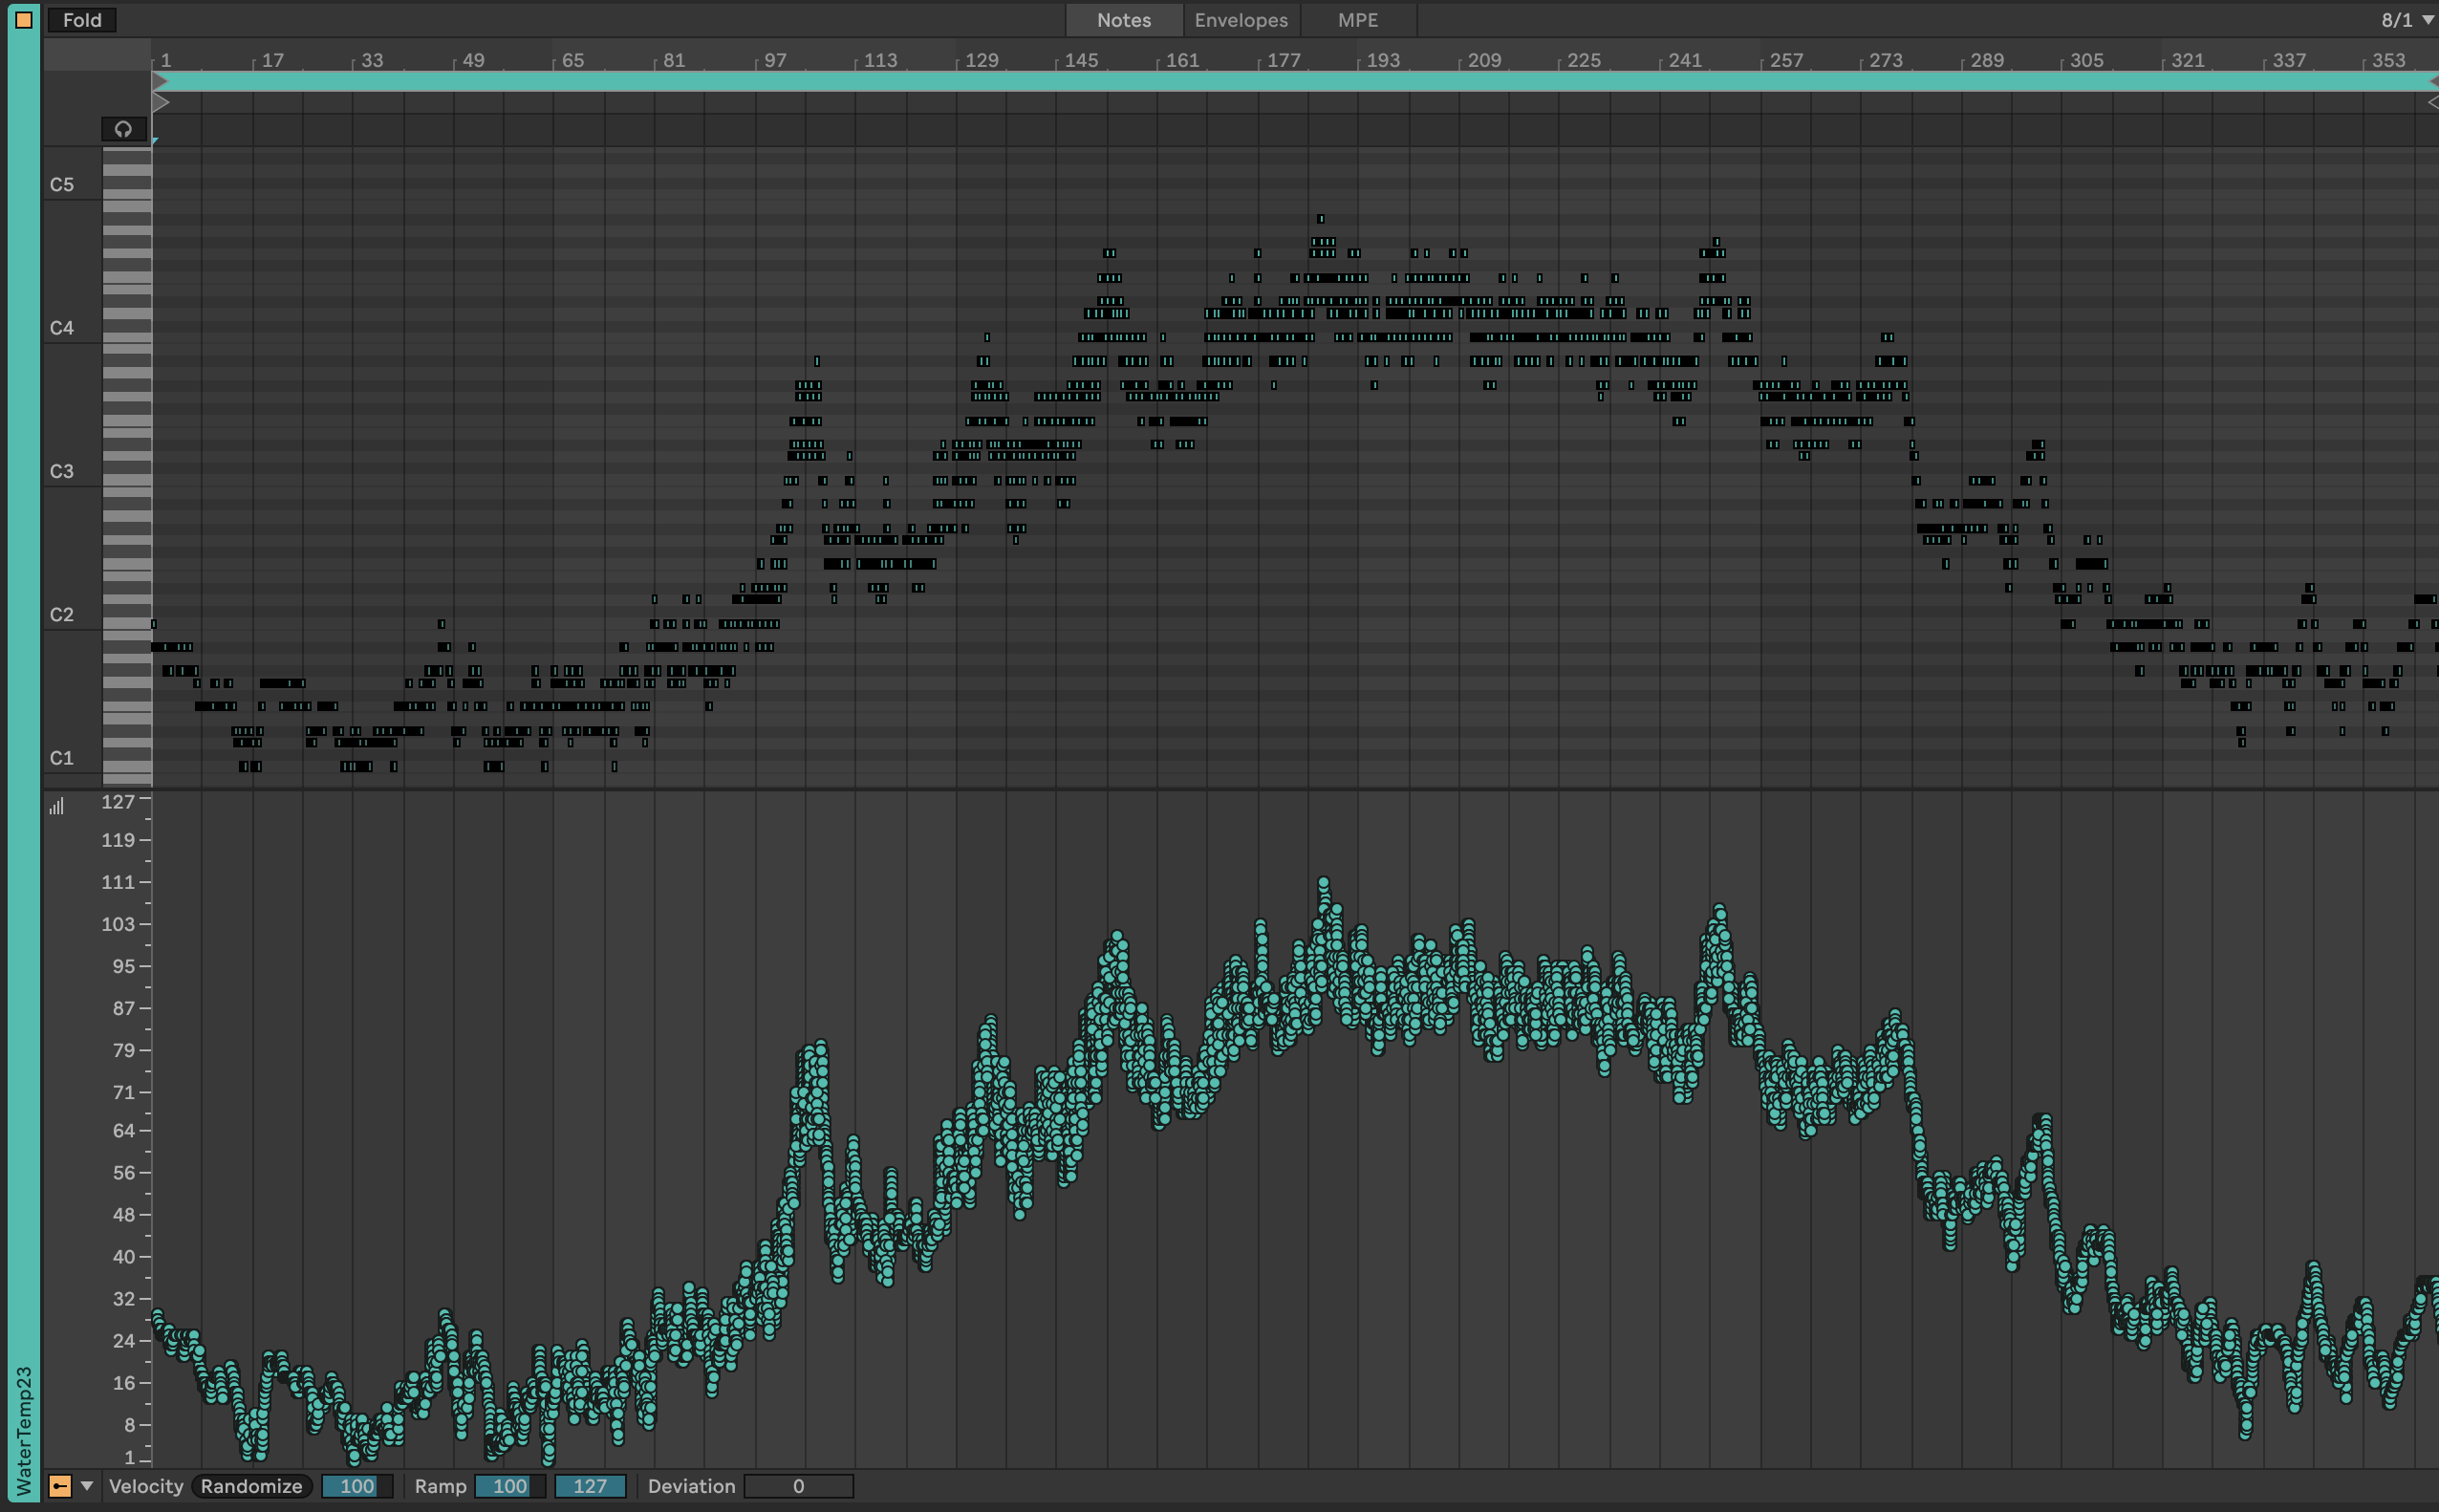
The main tool for translating the data into sound was MIDITime, which is a Python script that can convert timestamped data into musical notes. The MIDI notes can then be played on any synthesizer or DAW (Digital Audio Workstation). This process was carried out for all of the datasets I collected, each of which was then imported into a DAW. Below is a screen capture from the DAW showing the 34,969 notes generated by MIDITime. Each note’s pitch and velocity (loudness) value is determined by a measurement of water temperature of the Don River in 2023. The pitch of each note is shown in the top half (in rows corresponding to four octaves on a piano keyboard). MIDITime scales the minimum and maximum values of the data set (0.4 – 25.1 degrees Celsius) to the note range I chose for this clip (in this case, four octaves or 48 notes). The loudness of each note is shown at in the bottom half, with values ranging from 0 – 127 (again, these are scaled up from the original range of 0.4 – 25.1 degrees Celsius). Since the data starts on January 1 and ends on December 31, it was not surprising to see that the notes at the beginning and the end of the clip are low in pitch and volume since these notes correspond to measurements of water temperature in the winter months, and notes in the middle of the clip (corresponding to June, July and August) are higher in pitch and volume.
In some cases, such as TRCA measurements of solar radiation throughout the year, I decided to use a synthesized sound as the instrument triggered by the MIDI notes. But most of the sounds that can be heard in the composition were not synthesized. The wind, water, snow and rain sounds were all recorded through a Zoom mic and Audiomoth monitoring devices near the location of Station 19 on the Don River and are triggered by MIDI notes and their associated parameters (e.g., the velocity and loudness of each note is determined by the value of the sensor reading). In this way, the recorded sounds (or short clips of them) were imported into the DAW and were triggered by the data points indicating increases or decreases in, for example, wind speed or water level.
In the clip below, the sound in the blue track is being triggered by solar radiation levels when the water temperature is below 20 degrees. When the water temperature rises to 20 degrees and above (mid-June in 2023), the instrument triggered by solar radiation changes. In this case, the pink track also contains coronal mass ejections (CMEs) from the sun, the magnetic fields of which can generate geomagnetic storms that interfere with technical infrastructure such as satellites, radio transmissions, power grids, undersea cables and above and below ground pipelines. In the summer when water temperature is above 20 degrees, notes representing the timing and intensity of CMEs act as the “gate” that lets through the sounds linked to solar radiation. In other parts of the composition, CMEs are representing by a buzzing sound, and solar flares trigger a low pitched hum.
With the tempo set to 60 beats per minute and the amount of time to represent a year set to 1,460 seconds, I was able to make each day correspond to a bar of music in 4/4 time. This helped me keep track of where I was in terms of days of the year as I was composing the piece in the DAW. A year of time in the data set corresponds to 1,460 seconds (24 minutes and 20 seconds) in the composition, which means the MIDI files were 24 minutes and 20 seconds long.
As I began to layer the different MIDI files from the various data sets, I became interested in the way the data streams can modulate one another. Since the piece centres on the Don River, water flow and level modulate all of the other sounds. For example, as you can hear in the clip above, the sun’s sounds change depending on the water temperature (the thin vertical line is the point in the year where river temperature is consistently above 20 degree Celsius). In this way the sonic texture or timbre of the instrument assigned to solar data changes with seasonal variations in water temperature. There is an interesting feedback loop here since solar radiation, which influences water temperature, is in turn affected by changes in water temperature. Storm surges, which typically happen after a lot of rainfall, periodically drown out the sound of the sun, as though the microphone capturing those sounds is being submerged in the river.
Email:
jshiga@torontomu.ca
