The River as Data: Sonifying Smart Governance


Stills from The River as Data. Images: John Shiga.
The River as Data transforms a year of high-resolution environmental data from Toronto’s Don River into a multi-channel audiovisual composition. Drawing from open datasets and solar activity records, I developed a custom Python tool to map water levels, solar radiation, and temperature fluctuations to sound and image. The project is rooted in a critical engagement with “smart governance”—emerging regimes of urban environmental management that recode waterways as productive data infrastructures.
▶ Click to read more
Using hundreds of thousands of data points measuring wind, water level, temperature and precipitation from January 1 to December 31, 2023 collected by the Toronto Regional Conservation Authority (TRCA), this project turns water and weather conditions of the Don River in Toronto into a soundscape.
Much of this data comes from TRCA’s Station 19 and several other gauging stations along the rivers in the Toronto area which measure water level, flow, temperature and precipitation at regular intervals. This project combines a year’s worth of this data about the Don River with solar activity data such as solar flares and Coronal Mass Ejections into a 24-minute soundscape. Each data stream has its own voice which interacts with the others. Some of these sounds, such as the sounds trigged by solar activity, are synthesized while others, such as wind, rain, snow and underwater currents, were recorded along the Don River.

The first step in creating this soundscape was to access the data. I was able to obtain measurements of water level, water temperature, water flow, precipitation and solar radiation data from the TRCA’s Open Data Portal. What makes the TRCA data so useful for this project is that is the sensor readings are captured very frequently. For certain types of data, such as solar radiation, the sensor readings are captured every 5 minutes, in others cases, such as water temperature, they are captured every 15 minutes. This is very high resolution data – much higher than one would normally find in public databases of historical weather. To give you an idea of the resolution, there were 34,969 measurements of water temperature and 123,792 of solar radiation covering the period January 1 – December 31, 2023. Below is a sample of the solar radiation data from the TRCA Open Data Portal (value = watts per square metre) from 12:00 – 12:40 pm on June 21st, 2023.

Since the TRCA’s data collection included solar radiation data, I was interested in exploring how other kinds of solar activity might be integrated into the composition as a way of connecting micro-level variations in water, wind, etc. at a specific site on the Don River to macro-level fluctuations of energy – not only on a planetary level but also on the heliospheric level (i.e., systems influenced by the sun). To do this, I integrated data from NASA’s First Fermi-LAT Solar Flare Catalog (FLSF) and the SEEDS catalogue of Coronal Mass Ejections and filtered the list to focus on events that had a high enough magnitude to affect GPS and other navigations systems as well as radio communications. These datasets were filtered so that they align with the 2023 data I obtained from the TRCA.
The main tool for translating the data into sound was MIDITime, which is a Python script that can convert timestamped data into musical notes. The MIDI notes can then be played on any synthesizer or DAW (Digital Audio Workstation). This process was carried out for all of the datasets I collected, each of which was then imported into a DAW. Below is a screen capture from the DAW showing the 34,969 notes generated by MIDITime. Each note’s pitch and velocity (loudness) value is determined by a measurement of water temperature of the Don River in 2023. The pitch of each note is shown in the top half (in rows corresponding to four octaves on a piano keyboard). MIDITime scales the minimum and maximum values of the data set (0.4 – 25.1 degrees Celsius) to the note range I chose for this clip (in this case, four octaves or 48 notes). The loudness of each note is shown at in the bottom half, with values ranging from 0 – 127 (again, these are scaled up from the original range of 0.4 – 25.1 degrees Celsius). Since the data starts on January 1 and ends on December 31, it was not surprising to see that the notes at the beginning and the end of the clip are low in pitch and volume since these notes correspond to measurements of water temperature in the winter months, and notes in the middle of the clip (corresponding to June, July and August) are higher in pitch and volume.

In some cases, such as TRCA measurements of solar radiation throughout the year, I decided to use a synthesized sound as the instrument triggered by the MIDI notes. But most of the sounds that can be heard in the composition were not synthesized. The wind, water, snow and rain sounds were all recorded through a Zoom mic and Audiomoth monitoring devices near the location of Station 19 on the Don River and are triggered by MIDI notes and their associated parameters (e.g., the velocity and loudness of each note is determined by the value of the sensor reading). In this way, the recorded sounds (or short clips of them) were imported into the DAW and were triggered by the data points indicating increases or decreases in, for example, wind speed or water level.
In the clip below, the sound in the blue track is being triggered by solar radiation levels when the water temperature is below 20 degrees. When the water temperature rises to 20 degrees and above (mid-June in 2023), the instrument triggered by solar radiation changes. In this case, the pink track also contains coronal mass ejections (CMEs) from the sun, the magnetic fields of which can generate geomagnetic storms that interfere with technical infrastructure such as satellites, radio transmissions, power grids, undersea cables and above and below ground pipelines. In the summer when water temperature is above 20 degrees, notes representing the timing and intensity of CMEs act as the “gate” that lets through the sounds linked to solar radiation. In other parts of the composition, CMEs are representing by a buzzing sound, and solar flares trigger a low pitched hum.
With the tempo set to 60 beats per minute and the amount of time to represent a year set to 1,460 seconds, I was able to make each day correspond to a bar of music in 4/4 time. This helped me keep track of where I was in terms of days of the year as I was composing the piece in the DAW. A year of time in the data set corresponds to 1,460 seconds (24 minutes and 20 seconds) in the composition, which means the MIDI files were 24 minutes and 20 seconds long.
As I began to layer the different MIDI files from the various data sets, I became interested in the way the data streams can modulate one another. Since the piece centres on the Don River, water flow and level modulate all of the other sounds. For example, as you can hear in the clip above, the sun’s sounds change depending on the water temperature (the thin vertical line is the point in the year where river temperature is consistently above 20 degree Celsius). In this way the sonic texture or timbre of the instrument assigned to solar data changes with seasonal variations in water temperature. There is an interesting feedback loop here since solar radiation, which influences water temperature, is in turn affected by changes in water temperature. Storm surges, which typically happen after a lot of rainfall, periodically drown out the sound of the sun, as though the microphone capturing those sounds is being submerged in the river.
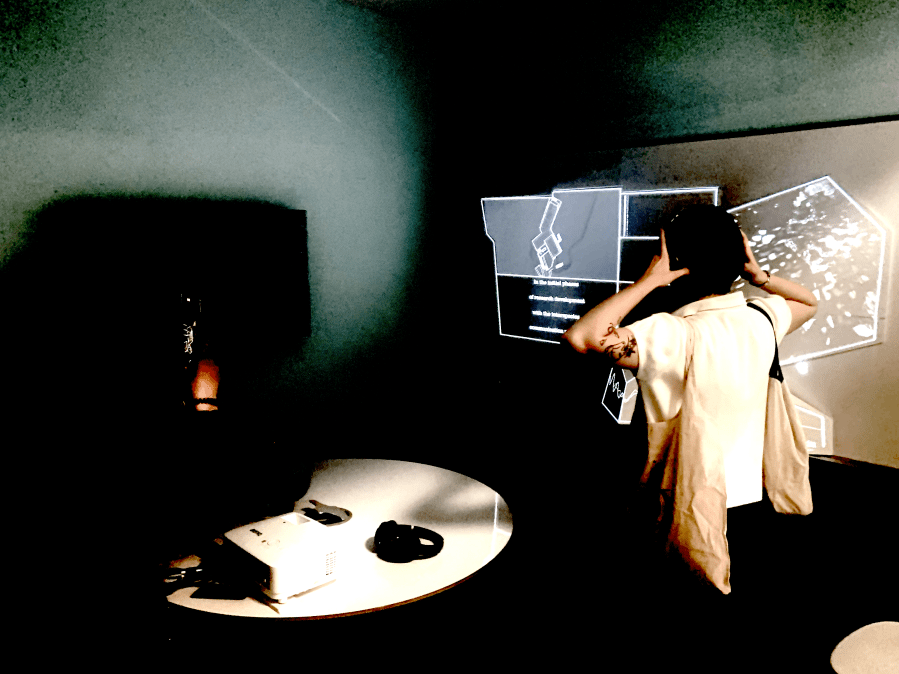
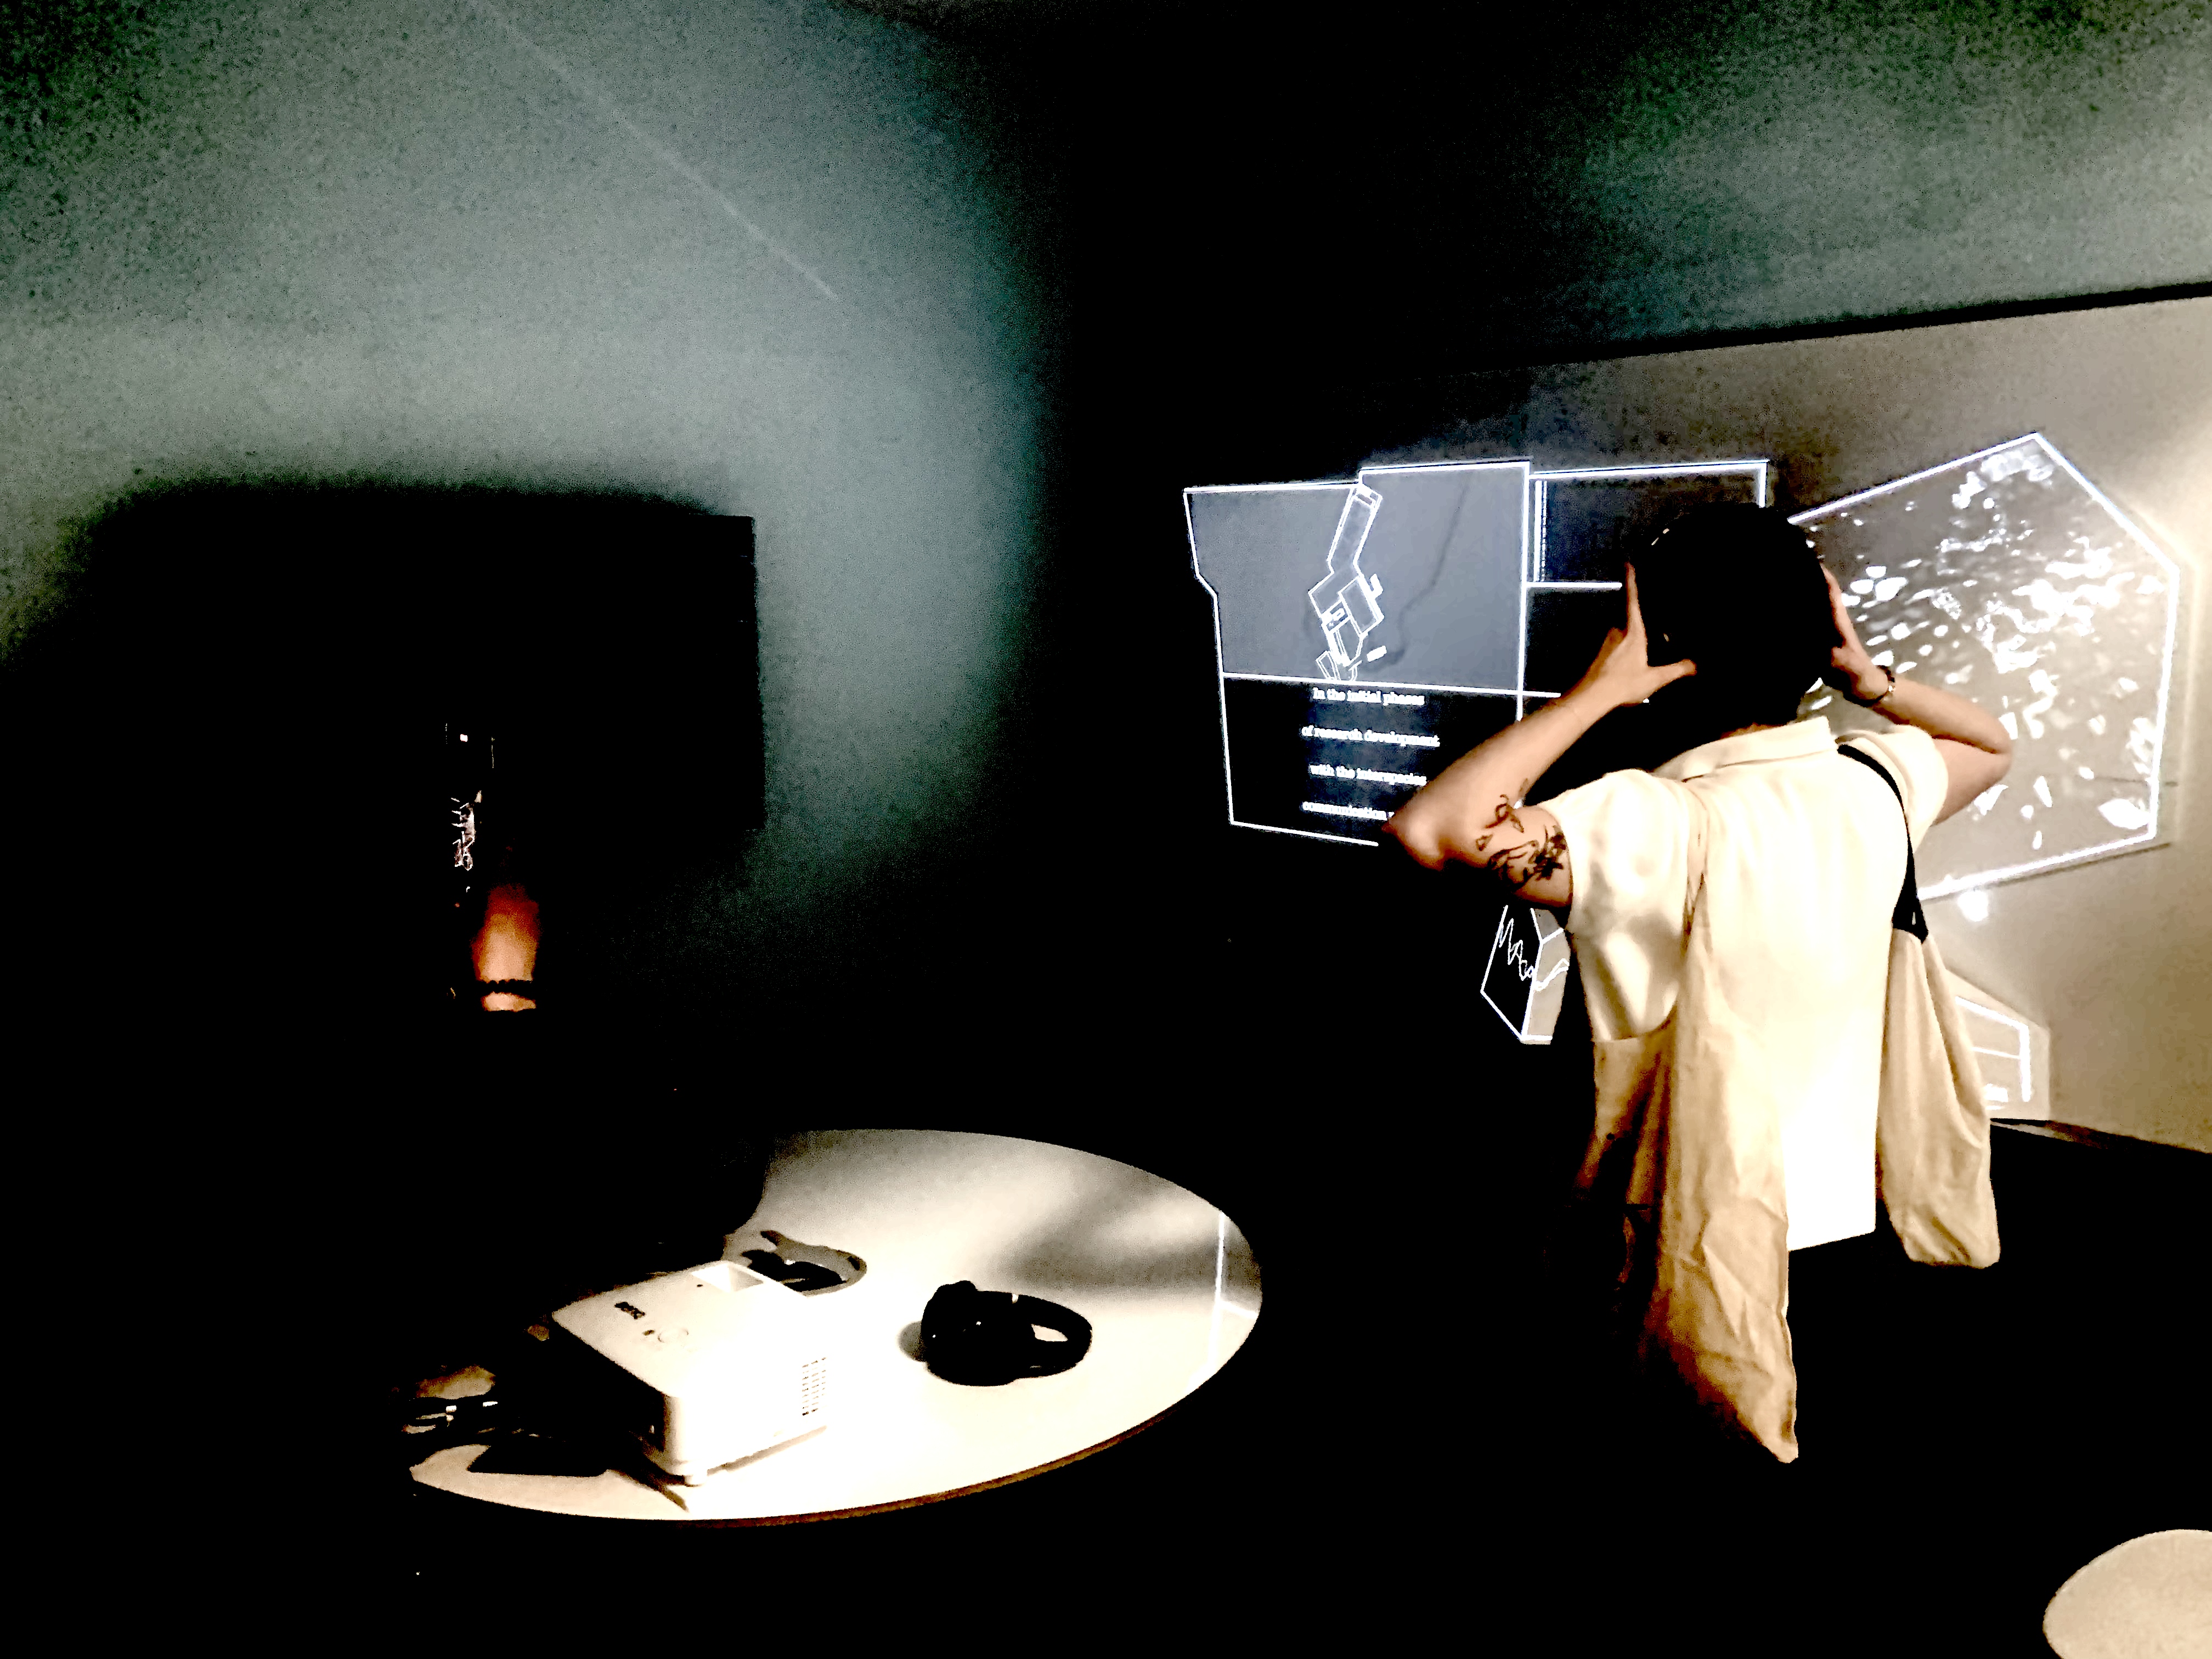
Refractions: Making Cold War Archives Audible

Photograph of Margaret Howe and a dolphin on the flooded balcony at the Communication Research Institute, St. Thomas, U.S. Virgin Islands. Image: John C. Lilly Papers, M0786. Department of Special Collections and University Archives, Stanford University Libraries, Stanford, California.
Refractions is a sound and projection installation that reimagines Cold War-era dolphin-human communication research through archival audio, data sonification, and storytelling, revealing the entanglement of this work with military-scientific infrastructures and using the concept of “refraction” to explore how sound, signals, and histories shift as they move across mediums, institutions, and species.
▶ Click to read more
Combining archival material, data sonification (sonic representations of data) and storytelling, Refractions sonically remaps Cold War research on human-dolphin communication and situates it within the vertical cartography produced by the global expansion of military and scientific remote sensing infrastructures. The composition is based on archival recordings produced at John C. Lilly’s Communication Research Institute’s (“CRI”) Dolphin Point Laboratory in St. Thomas, U.S. Virgin Islands where Lilly and his team carried out an ambitious research program that aimed to establish two-way communication between humans and dolphins.
The installation’s guiding creative principle is notion of “refraction,” or the process of distorting, bending and altering the direction of a signal as it moves from one medium into another. For military scientists, and for the team at the CRI, refraction was a challenge to be overcome since it distorts sounds as they move from air into water, and vice versa. Devices such as hydrophones (underwater microphones) were designed to overcome this problem. In my project, I use refraction as a way of thinking about the possibilities for intervening in the way archival documents and sound recordings travel through institutional spaces and their effects on bodies and material environments.
Refractions began as a tool for research on the history of the CRI. I initially arranged the archival recordings into “rooms” on a Digital Audio Workstation so that I could listen to them in a systematic but non-linear way as part of my research on this history of sound in the Cold War. Gradually, the DAW setup and the processed recordings evolved into Refractions, which recreates the soundscape of St. Thomas facility and, just as importantly, retraces the institutional and technological networks that supported and shaped the CRI.
The U.S. Navy, Air Force, NASA, among other scientific and military institutions, provided funding and other support to the CRI to develop the St. Thomas facility and carry out a novel but controversial research program on human-dolphin communication. These institutions had a shared interest in advancing Lilly work for various Cold War-related ends related to the conquest of vertical space (ocean, atmosphere, outer space).
Images of The Dolphin House installation, including stills from the video component and photographs of audience interaction. Images: John Shiga.
One of Lilly’s key collaborators, who can be heard in several parts of installation, was Margaret Howe. Howe was a key figure in the development and implementation of a months-long experiment in which she would live with a dolphin 24-hours a day for several months to accelerate the “reprogramming” of dolphins to communicate with humans (a story that has been retold in a number of news stories in recent years as well as a BBC documentary). The redesigned lab, informally referred to as the “flooded house” or the “dolphin house,” was configured to facilitate prolonged human and dolphin cohabitation through, for example, rooms and a balcony flooded with 18 inches of water. It was also fitted with microphones suspended from the ceilings to record dolphin vocalizations as well as Plexiglas tanks in which dolphins would listen to recordings of human speech and be rewarded with fish for attempting to mimic the sounds of the humans. Just as the house was flooded to bring human and dolphin participants close together for weeks or even months at a time, so too the house was saturated with acoustic technologies for capturing and manipulating the vocal sounds of humans and dolphins.
Unintentionally, the recording system picked up various types of “noise”: elemental (e.g., water and wind), technological (e.g., tape hiss), and social (conversations that were not so much documenting interspecies communication research but expressing frustration with various aspects of working at the lab). These noises have been processed and arranged in installation to create a “sonic blueprint” of the CRI and its interior spaces. Like the blueprint for a building, which outlines the spaces for people and objects as well as the underlying infrastructure, the sound composition of the installation has several layers which in this case correspond to human-dolphin communication research practices and the military-scientific apparatus that supported it. The sound composition pieces together parts of the CRI’s archival recordings into separate streams of sound for humans and dolphins which periodically interact. Additionally, the sound composition situates the CRI’s work within the broader military-scientific infrastructure of remote sensing. The installations other sonic layers were produced by “following the money,” that is, by retracing the CRI’s funding agencies and their activities around the world during the 1960s. In this way, the installation foregrounds what was so often left out of contemporaneous popular media and scientific discourse about Lilly’s work: the fact that the CRI was, from a military perspective, one node among many in a planet-spanning network of command, control and communication.
The composition is organized into seven parts, each of which focuses on a specific room or facility in the CRI and the sonic environment created by the interaction of the building with the technological and natural environments in which it was embedded as well as the human and nonhuman actors who inhabited the various spaces of the lab. Here is an excerpt from “Dolphin Elevator” – a segment of the composition set in the facility’s sea pool:
Featuring the voice of one of the CRI researchers (possibly its former director, Gregory Bateson, though this isn’t indicated in the archives’ note for this audio tape), the sound composition turns to a seemingly tranquil moment in the archival recordings. In keeping with the practice of the CRI, the researcher describes what he is seeing and hearing as a way of providing an auditory version of a lab report or field notes. In this instance, one of dolphins is being moved onto the elevator from the sea pool (used mainly for visual observation through a large window at the base of it) to the upstairs pool (used mainly for audio recording since it was shielded to some degree from the wind and sounds of the ocean). Texturally, the composition gestures to the openness and optimism of the researchers in the early years of the project. At the same time, the high frequency “beeps” are sonifications of the U.S. military’s Corona spy satellite program. Each of the ten beeps (the sequence repeats in a loop) represents approximately 100 images (the Corona satellite captured 930 images in 24 hours on November 19, 1964). The pitch represents the latitude of the area captured in each photograph and the beep’s position in the stereo field represents its longitude. The locations are in the following order (using 1965 names): Soviet Union (northeast), Tibet, China, Kazakh SSR, Soviet Union (Moscow), Republic of Congo, Cuba, Haiti, Atlantic Ocean approximately 300 miles from San Francisco, Soviet Union (northeast).
Acknowledgments
I am very grateful to Philip Bailey and the Estate of John C. Lilly for giving me permission to use the Communication Research Institute’s audio recordings in this installation. I would also like to thank the staff of the Department of Special Collections and University Archives at Stanford University for their invaluable advice and support.
Becoming Radiogenic: Nuclear Colonialism in Canada
This research-creation project consists of an audiovisual composition and a written accompaniment, which work together to trace the discursive and material strategies of nuclear imperial power in Canada and Japan. The guiding question of this work concerns the agency of “radiogenic communities,” which have often been regarded as social effects of nuclear colonialism and tend to be defined as communities affected and altered by radioactive contamination and other forms of nuclear violence. How might our understanding of radiogenic community change if we shift the focus to the agency of these communities to define themselves through their ongoing struggle to represent their experience of and struggles against nuclear violence? How can radiogenic community be redefined so that it isn’t reduced to a condition of being affected by and subject to nuclear domination?
▶ Click to read more
My approach for exploring these questions through audiovisual composition is to re-center representations of nuclear violence around the epistemic agency of those subjected to it. I focus on two radiogenic communities: the Dene people, whose territory encompassed the Eldorado mine—where uranium was extracted for nuclear weapons production during the Second World War—and the hibakusha, survivors of the U.S. nuclear attacks on Japan. The composition combines archival materials related to nuclear imperialism in Canada with visualizations and sonifications of nuclear data collected by radiogenic communities and data visualizations.

In response to dominant representational practices and their framing of the nuclear weapons’ effects as indices of the new scale of imperial power, the composition amplifies the practices through which the Dene and the hibakusha articulated their relationship to places which were targeted for environmental ruin and socio-cultural dislocation by the racist, colonialist, militarist and capitalist structures of nuclear imperialism.

The composition was designed for the 360° screen in the Immersion Studio at Toronto Metropolitan University and was integrated into CMN 210 Text, Image, Sound – an undergraduate course I teach in the School of Professional Communication. The composition invites students and other listeners/viewers to consider “radiogenic community” as more than just a reaction to nuclear violence or a phenomenon that arises by virtue of a community’s exposure to radiation. Rather, this form of community emerges in the cases of the Dene and the hibakusha through repeated and determined efforts to reaffirm the existence and value of eco-social relations which bind together specific communities and places.
Audible Oceans: Media Archeology of the SOund SUrveillance System (SOSUS)

Overhead shot of the edge of a once-secret underwater listening station. Image: John Shiga.
During the Cold War, a network of underwater microphones (“hydrophones”) and listening stations in US, Canada, the Bahamas, Iceland and Wales monitored sound in the Atlantic in order to detect and track Soviet submarines. Today, some of the abandoned listening stations are still standing, though they are rapidly deteriorating. Using photography, field recording, animation and photogrammetry, I am creating virtual models of the listening stations to function as interactive platforms for public engagement with this once-secret undersea surveillance system and what it tells us about the transformation of ocean space and underwater sound during the Cold War.
▶ Click to read more”
I am particularly interested in the experiences of those who once worked in these facilities as well as the accounts of those who lived nearby. How did this environment shape the way people experienced the Cold War, ocean sound and ocean space more broadly? What new forms of identity and community were developed within and between the listening “nodes” of the network? How did the construction of these listening stations alter the physical environment and impact local economies, identities and culture? In collaboration with groups with expertise in acoustic ocean sensing and groups with lived experience of the network, the project aims to virtually reconstruct the infrastructure and material meanings of the network, and imagine what new forms of community could be developed around an “audible ocean.” Below are preliminary works which explore the historiographic, narrative and aesthetic possibilities afforded by abandoned sonar infrastructure as well as various media, formats and approaches for the design of physical and virtual models of these Cold War “ruins.”


Photographs of the listening station from July 2018 and August 2019. Images: John Shiga.
Using a drone, I captured several hundred aerial images of the site and used photogrammetry to construct a point cloud and a final meshed model of the station. The model is not the final product but rather a springboard for a participatory research-creation initiative in which “layers” are virtually added to the SOSUS model which integrate lived experiences of the social and environmental impacts of SOSUS as well as potential redesigns of the SOSUS stations which are creatively repurposed and restructured in a way that articulates and responds to the contemporary socio-environmental concerns of local communities.

Preliminary 3D model of SOSUS listening station. Image: John Shiga.
The digital models are being used to create physical models of the stations 3D-printed in white to facilitate projection of animated information directly on the structures themselves either through video projection or through users’ phones/tablets via AR. The projected animations will be designed to engage users on multiple levels, beginning with explanations of basic technology, institutional developers/users and impacts of the sonar network to the development of more critical forms of engagement with the central issues and questions that drive this project regarding the role of sonar in shaping perceptions, representations and uses of the deep ocean. The physical platform is relatively inexpensive and lightweight and takes advantage of the modularity and variability of Augmented Reality (AR) to deliver continuously-updated virtual layers to the user’s phone wherever the platform is installed. Crucially, the platform will also work as a knowledge-creation tool, enabling users to annotate or “tag” the AR layers of the model with sound, image or text which can then be seen/heard by subsequent visitors. The combination of physical display and augmented reality allows aspects of the official archival history of SOSUS, including its many gaps, redactions and silences, to be questioned, complicated and challenged.
3D-printed model of the listening station. A map found during one of my site visits is projected onto the surface of the model. Image: John Shiga.
On one level, the project works as a mode of preserving “acoustic ruins” which are deteriorating rapidly due to scavenging, redevelopment, weather and vandalism. However, the primary objective of the online platform is to translate the research findings about particular points of contact between sonar and ocean noise that will engage both academic and non-academic audiences in “ocean noise” from the Cold War to the present. By merging archival materials with my own photographic, video and audio recordings, the model will allow the user to see and hear how the space changes from the Cold War to the present but the project’s findings around the legacy of Cold War acoustemologies will foreground both the continuities and ruptures in the technologies, cultural practices and modes of perception that shape ocean noise then and now.
The goal is not only to provide access to the archival documents which this project has so far collected about the construction of sound and noise in SOSUS but also to enable users within and beyond the academy to engage in sonic historiography of SOSUS; this includes listening to the sounds and spaces of Cold War ocean surveillance and reflection upon the manner in which these acoustic elements shaped experience, identity, community and knowledge in relation to ocean space; sonic historiographic practice may also include application and repurposing of acoustic concepts (signal, noise, silence, echo, etc.) for detecting and problematizing patterns in archival materials (e.g., applying the sound/noise framework to understand what various publics can access, observe and interpret through barriers imposed by redactions, restrictions and over 700 abbreviations used in SOSUS documentation).

Still image from an audiovisual exhibit which juxtaposes a timelapse of SOSUS sites as they are activated along North American and European coastlines and in the Pacific, an animated 3D model of a SOSUS facility, and a sonification of censored information in military documents I obtained through an Access to Information request. Image: John Shiga.
As with the physical platform discussed above, which will be displayed in and redesigned by two communities in Atlantic Canada, the virtual platform will facilitate exploration of future uses a SOSUS-like acoustic “observatory”: how might the SOSUS network be reconfigured to constitute new forms of acoustic community, knowledge and experience? This latter component will be particularly useful for collecting stakeholders’ ideas about how to develop a larger-scale installation for engaging with Canada’s role on in enacting the acoustic front or border and its “vertical territory” in the Atlantic during the Cold War. The process of developing this experimental assemblage will be presented in a white paper to cultural heritage organizations and the Directorate of History and Heritage (DHH) outlining the value of material artifacts from the NAVFACs in Canada as sites of cultural memory and as platforms for public engagement with the audible history of military ocean sensing.
Further, the research-creation methodology of this project may be applied to other projects in critical studies of media infrastructure whereby the exploration, documentation and redesign of infrastructures aims not so much to preserve infrastructure “ruins” but to repurpose them as creative “diffraction apparatuses” which allow scholars and stakeholders to confront “sedimentations of past differentiations” – in this case, in the context of acoustic sensing systems – to better understand the material-discursive environment that made the acoustic enclosure of ocean space possible, and to imagine new ways of defining boundaries and shaping differences in ocean sound that might allow more open-ended and less instrumental, enclosed and extractive configurations of human activity and ocean environment to come into being (Schadler, 2019, p. 219).
Schadler, C. (2017). Enactments of a new materialist ethnography: methodological framework and research processes. Qualitative Research, 19(2), 215-230.


